

Documentation Index
Fetch the complete documentation index at: https://wb-21fd5541-docs-2661.mintlify.app/llms.txt
Use this file to discover all available pages before exploring further.
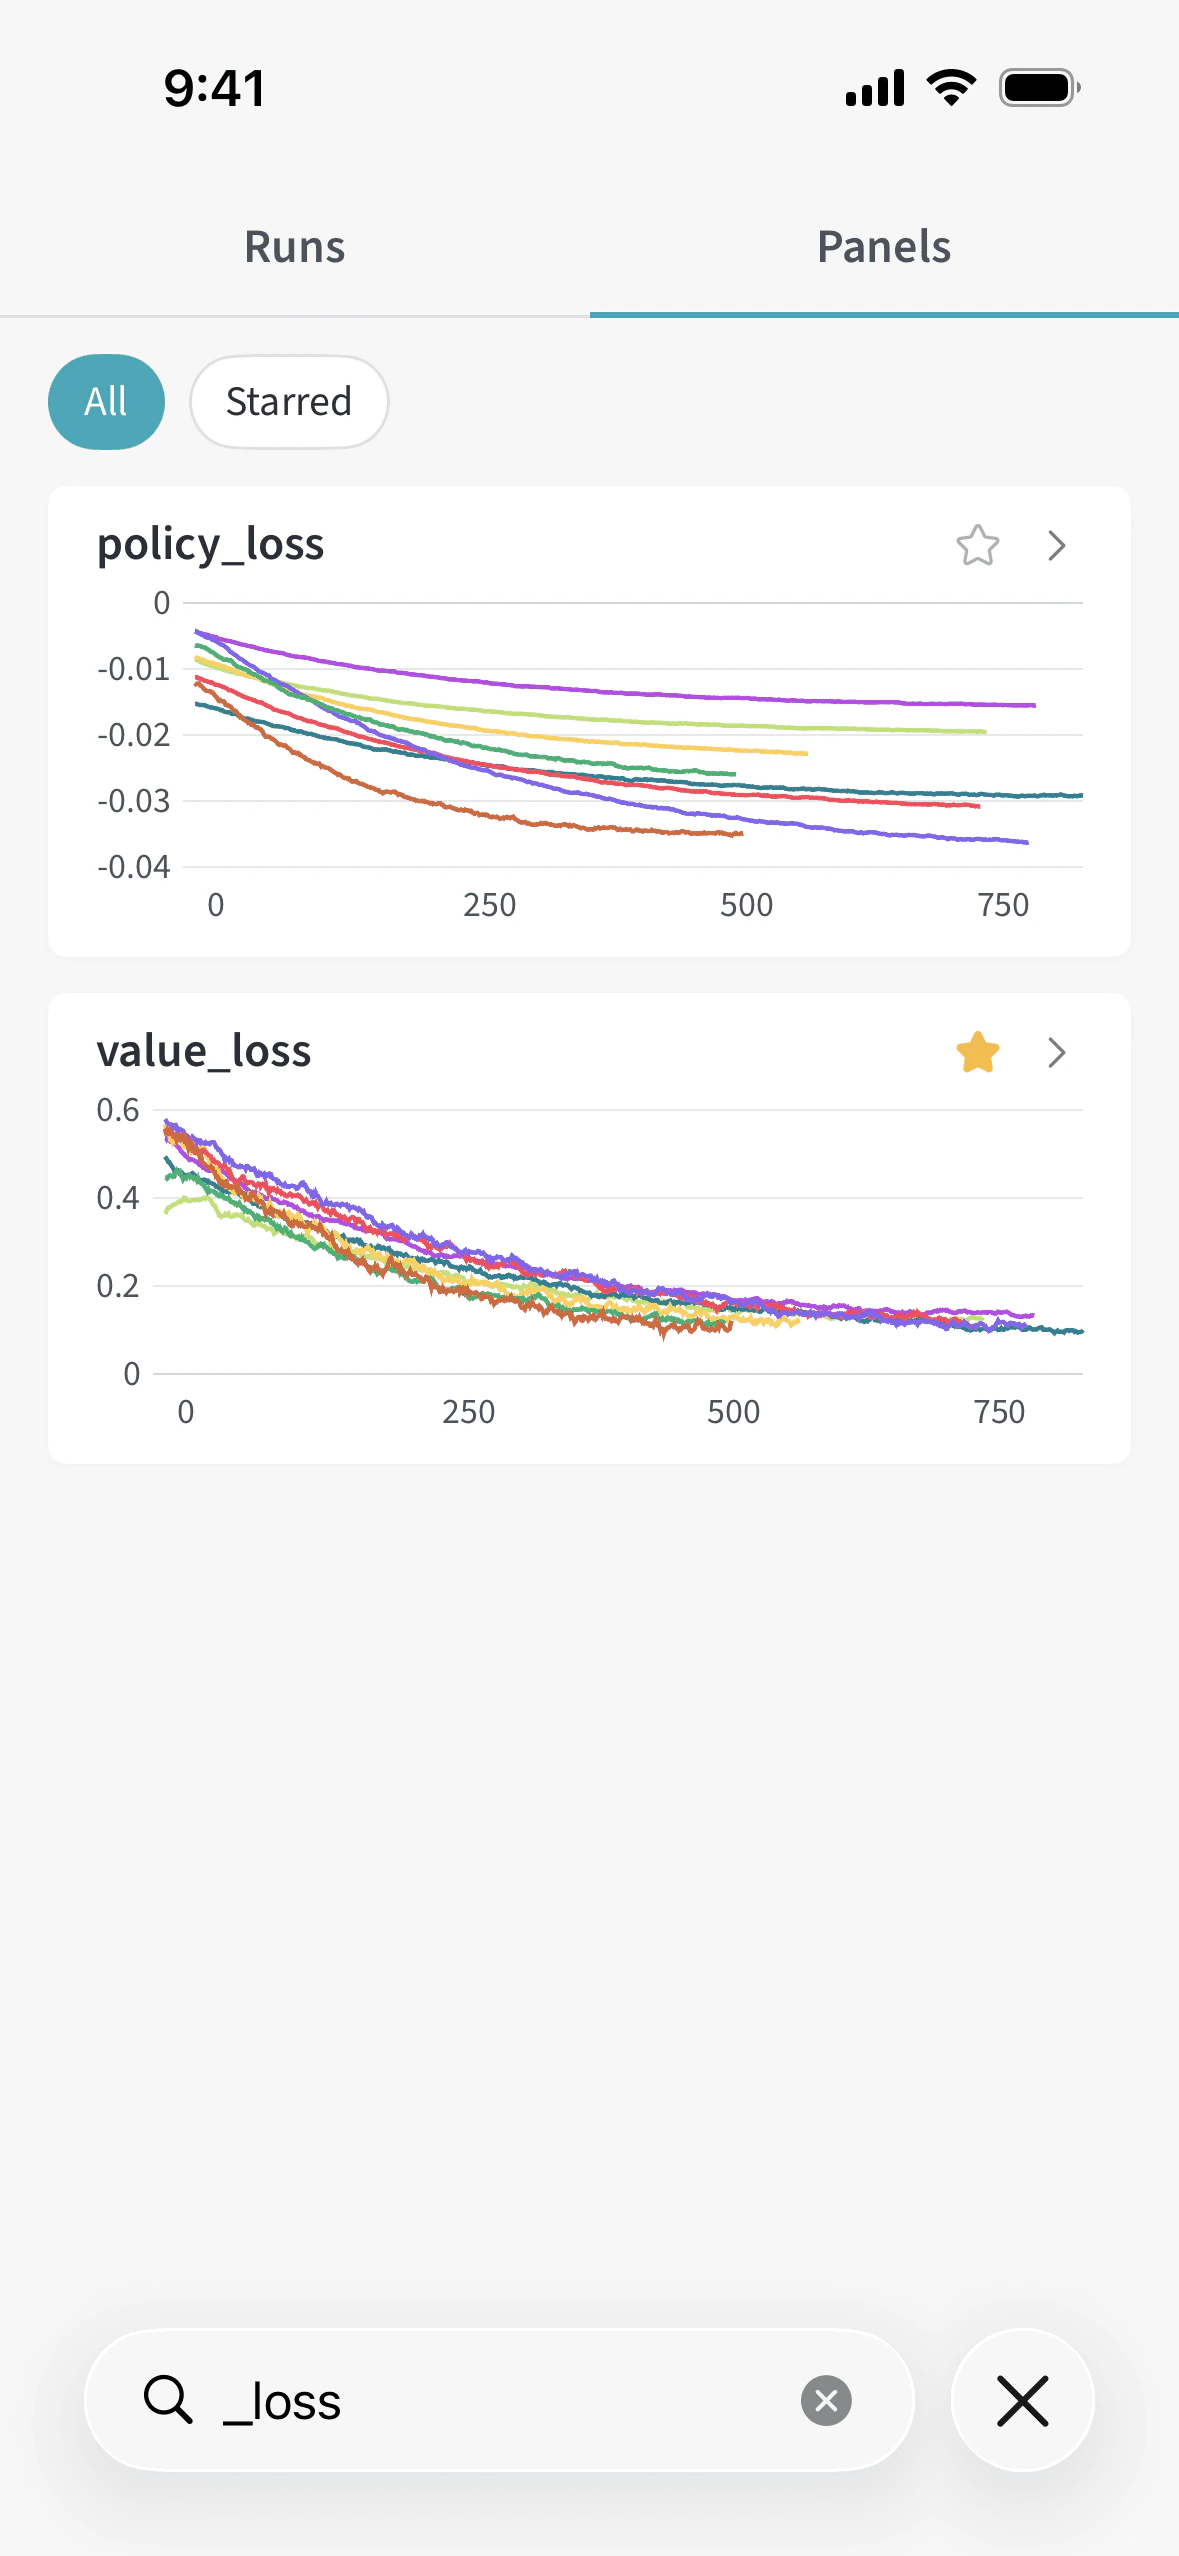
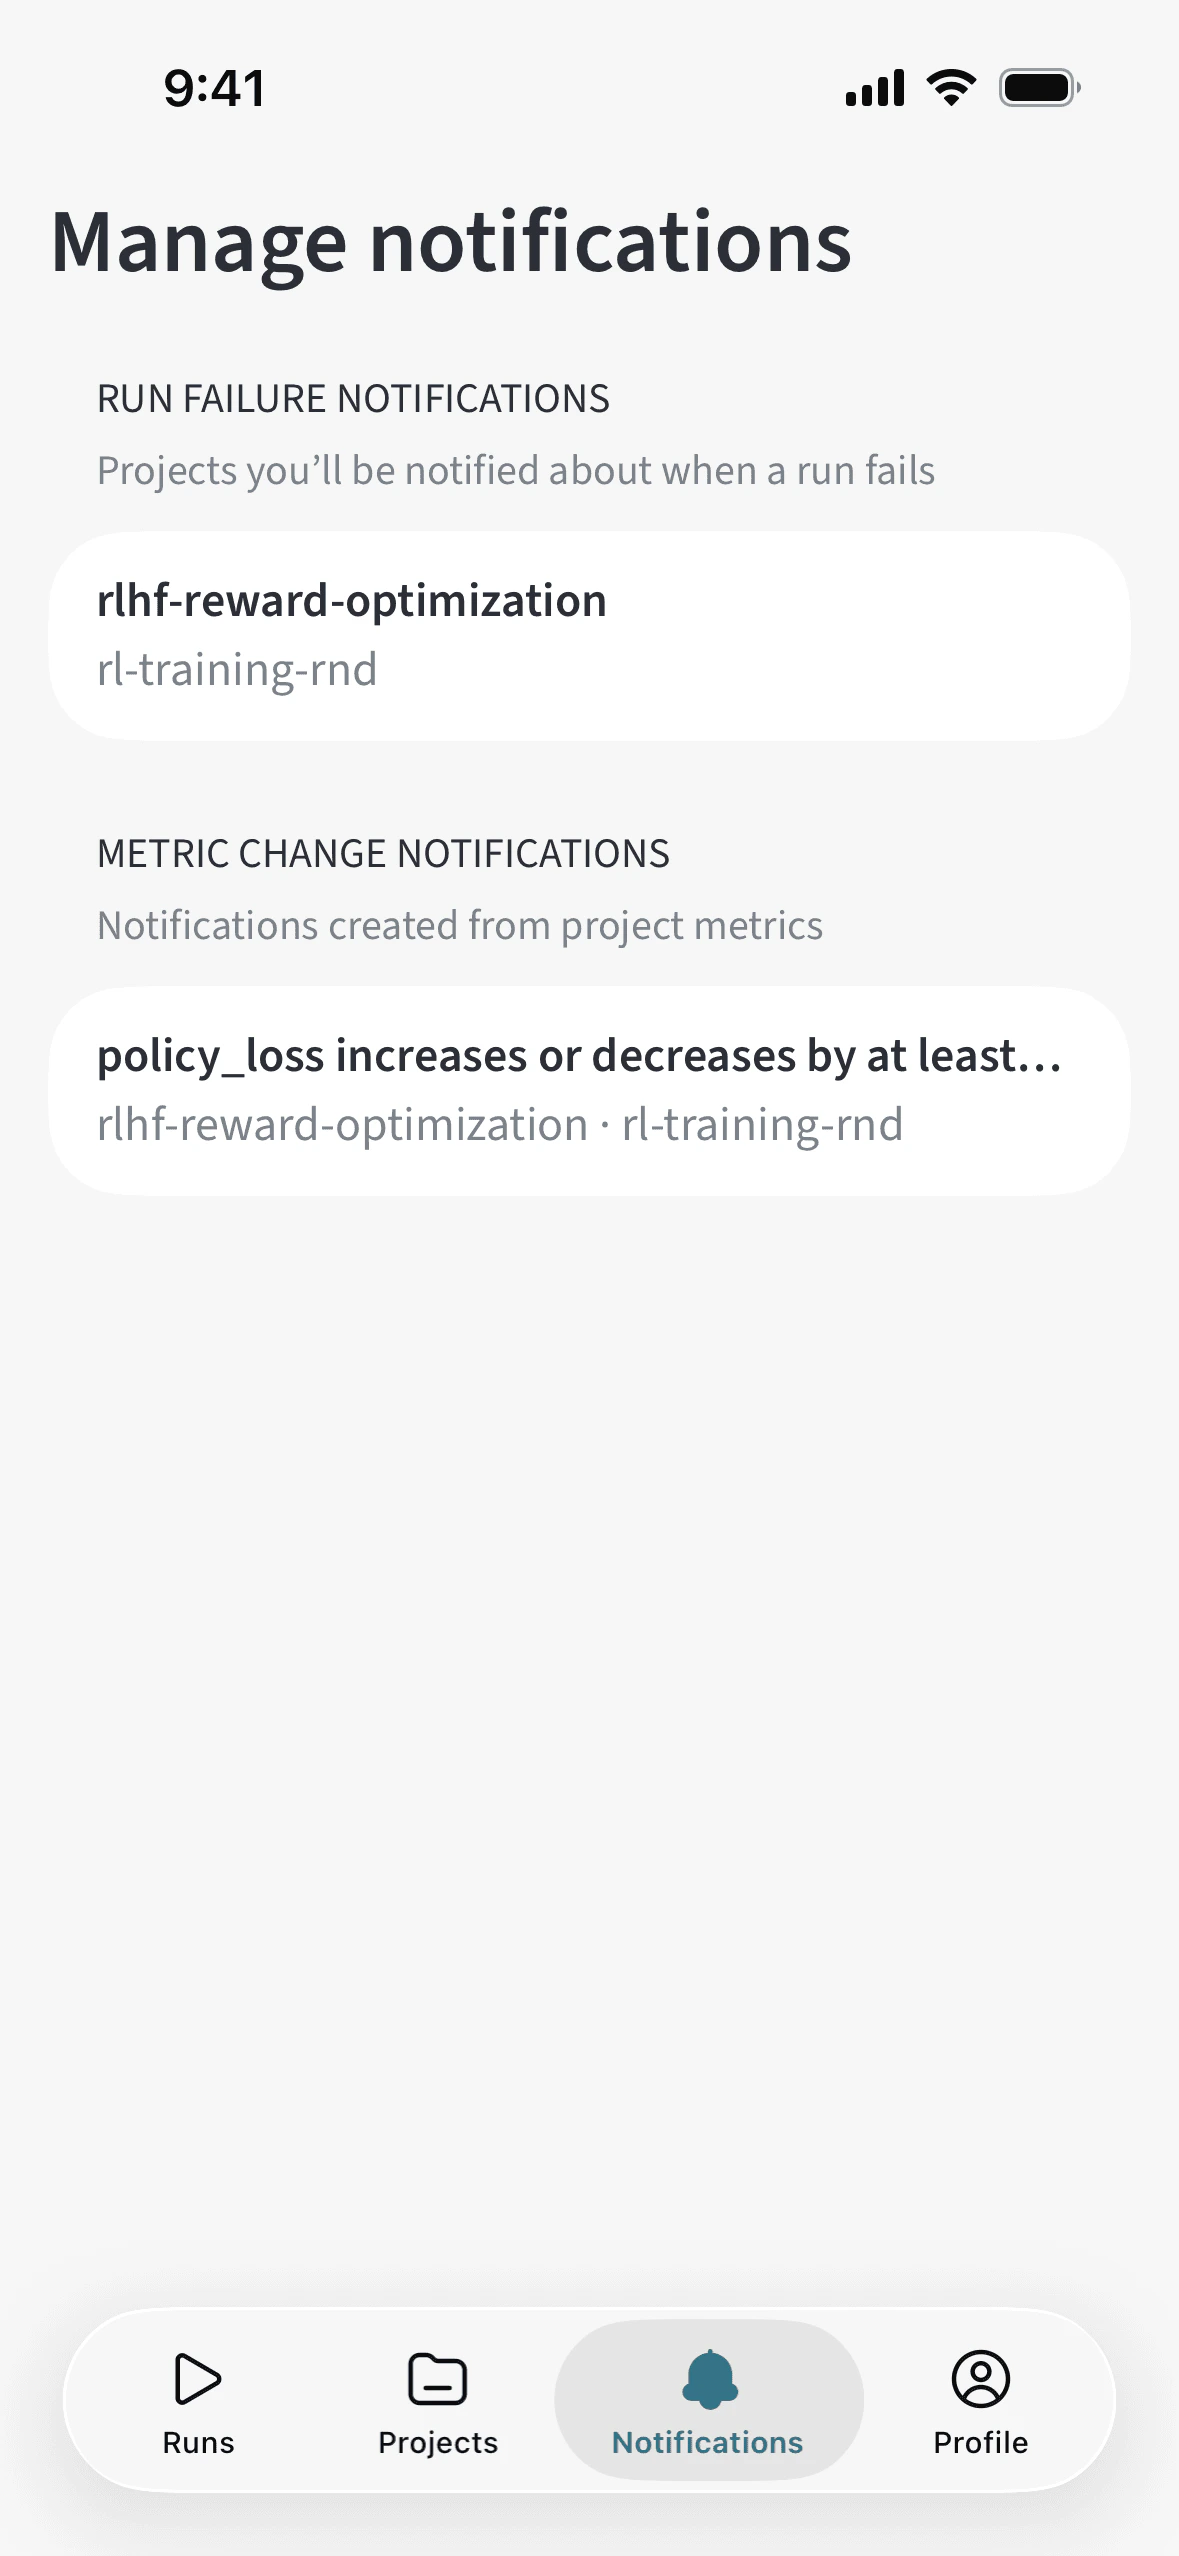
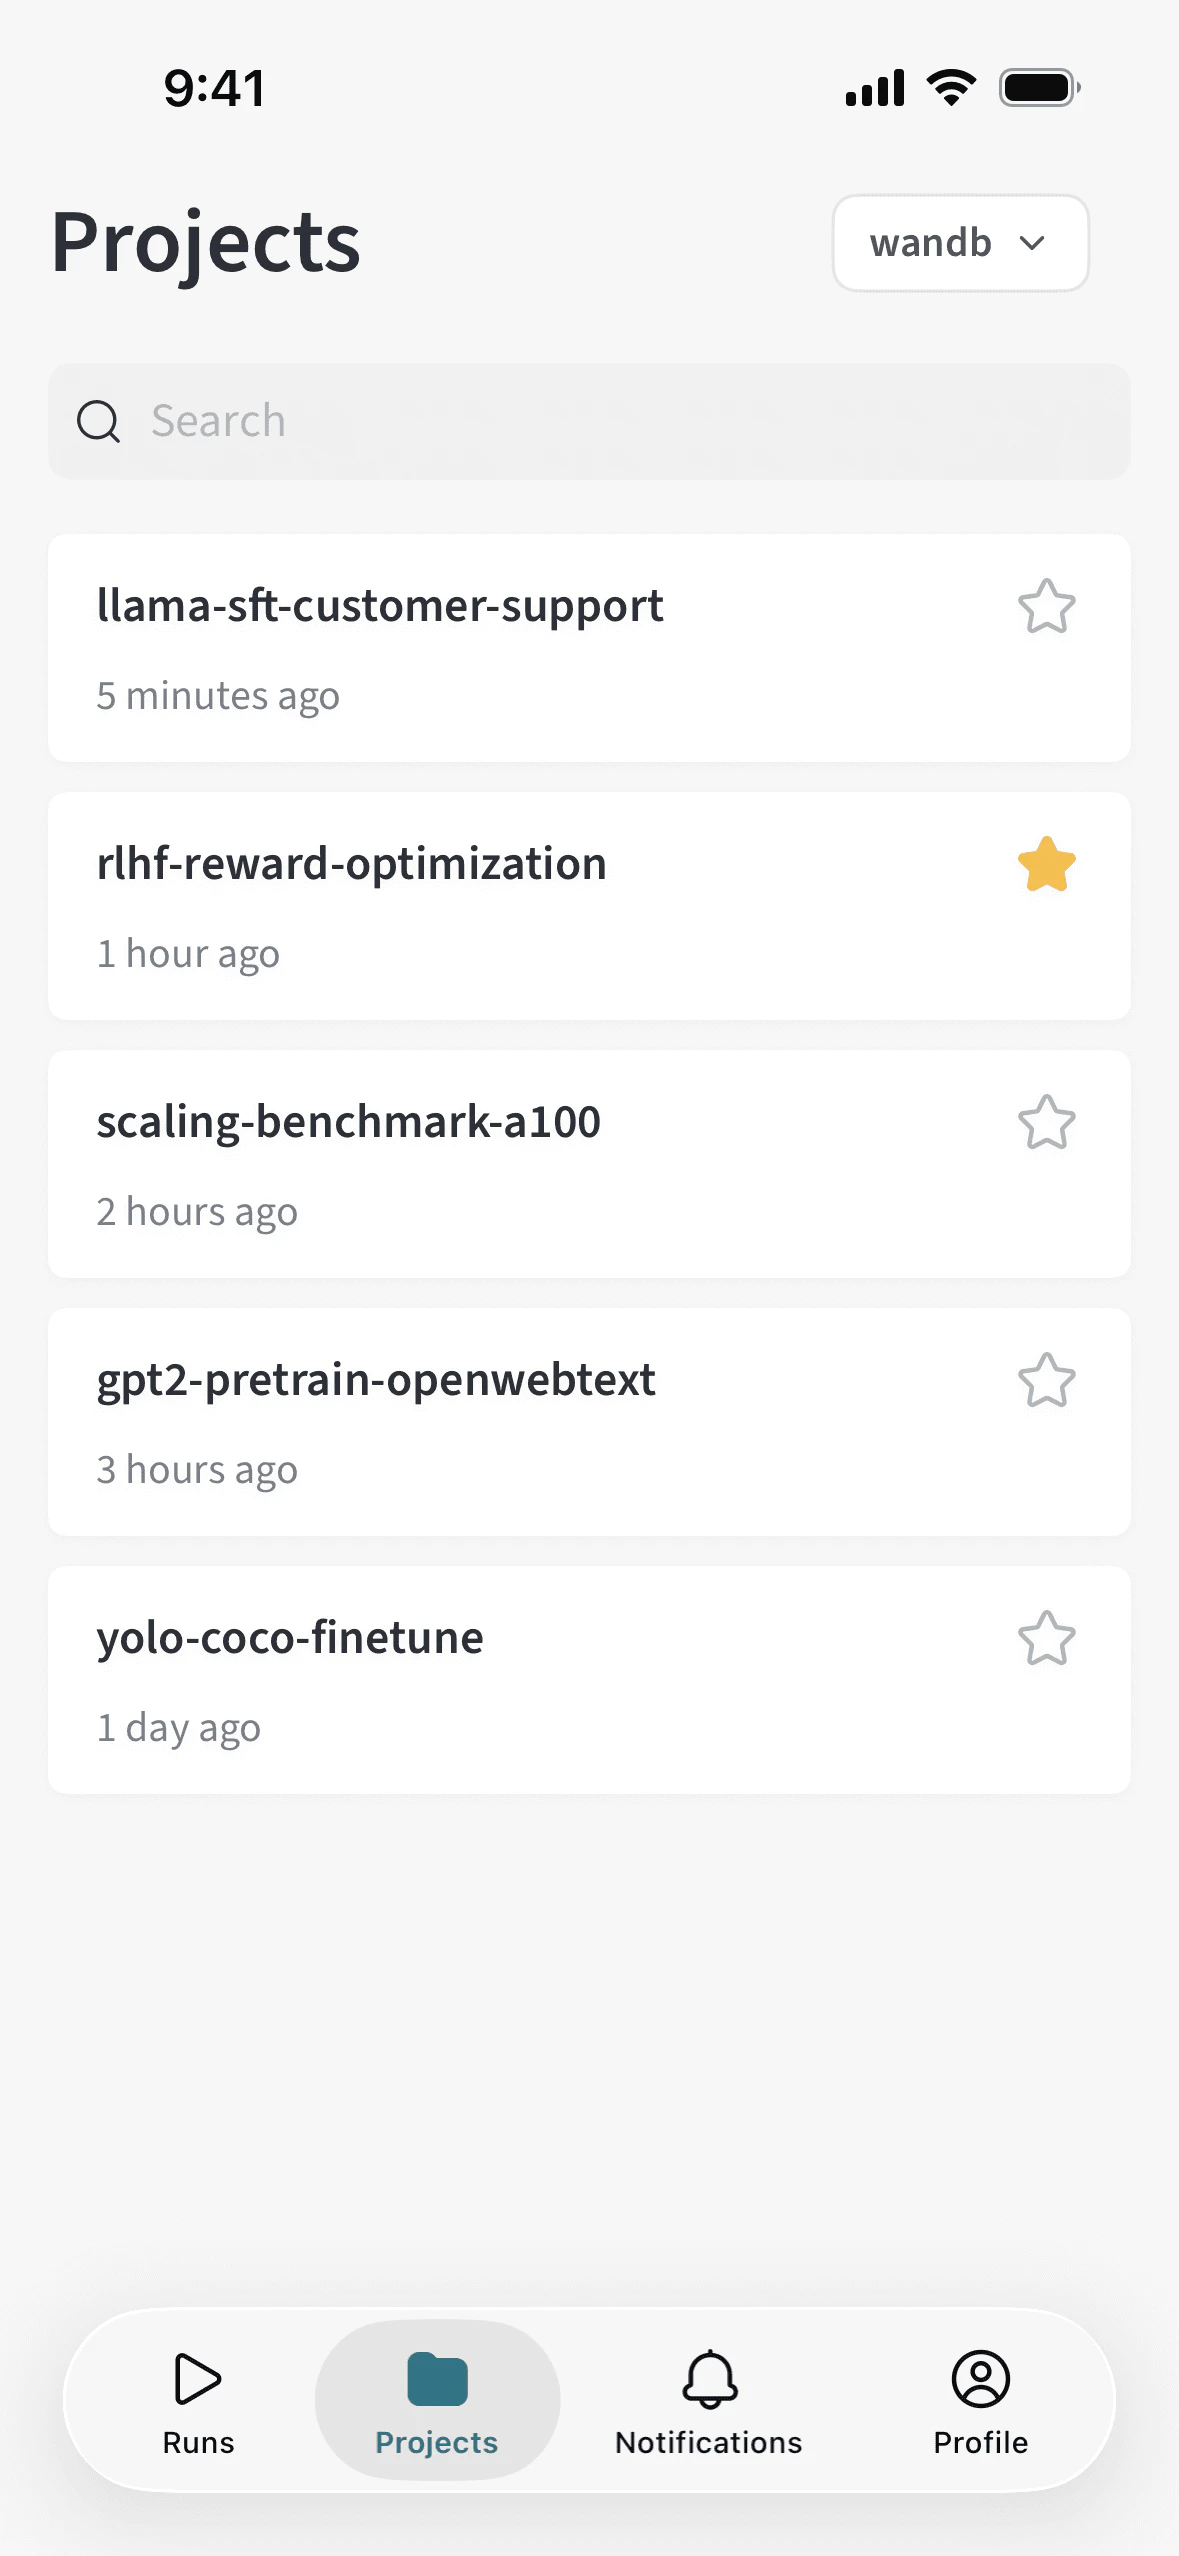
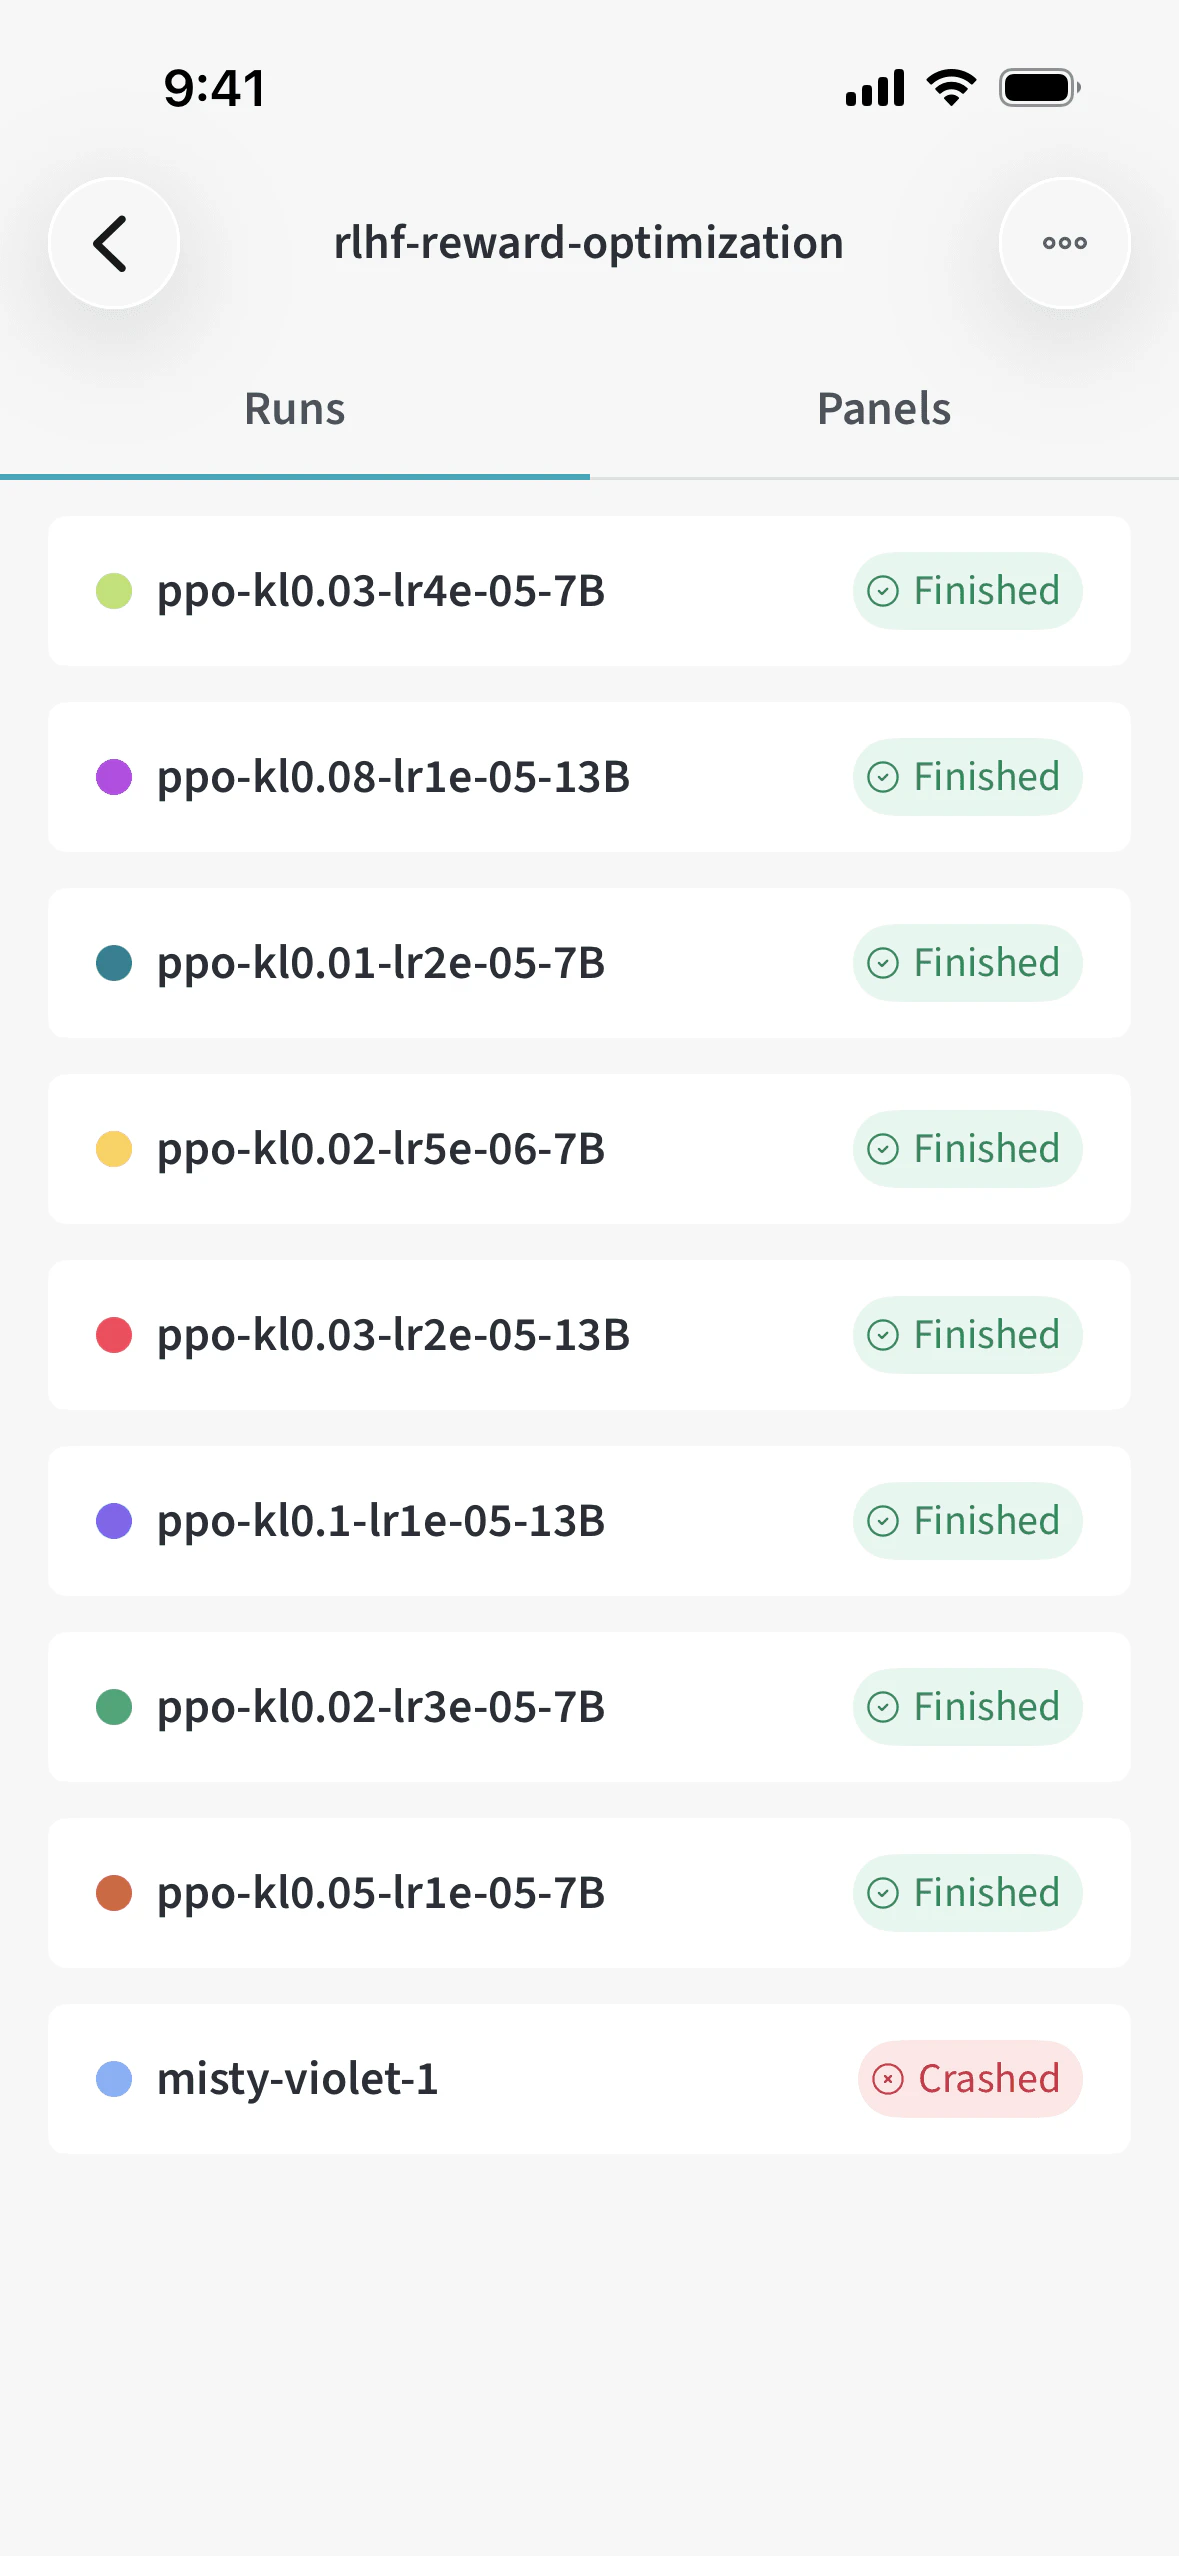
The mobile app is only available for Multi-tenant Cloud accounts. It isn’t available for Dedicated Cloud or Self-managed deployments.
Download the app
Install the app from the App Store to get started.Download on the App Store
Features
The following features are available in the mobile app.- Explore projects: Browse and search across your W&B projects.
- Full project history: Metric charts on project panels include data from all runs in the project, not only the latest run.
- Star projects: See your most important projects at a glance. Click the star icon next to a project to star it. To filter the list to only starred projects, click the Starred tab at the top of the list.
- Track experiments: View run status, metrics, and line plots for your experiments in real time.
- Live updates: Charts refresh as new data arrives. The Runs tab and project run lists update automatically when new runs start.
- Run overview tab: On each run, open the Overview tab for a dedicated summary of run details alongside metrics and logs. Long run config values wrap to multiple lines instead of truncating.
- View system metrics: On each run, open the Metrics tab to view system metrics that W&B logs automatically during training, such as GPU utilization, CPU usage, memory, disk I/O, and network traffic. System metrics appear in a collapsible System section alongside your logged metrics. Each metric displays as a line chart with the same tooltip and search behavior as other metrics on the tab.
- Mobile-optimized panel grouping: Panels are automatically grouped by name into collapsible sections. You can collapse the ungrouped metrics section to focus on named sections. Sections are a single level (not nested), and grouping follows the same rules as workspace panels in the W&B web app, so the layout stays consistent when you move between desktop and your phone.
- Star panels: See your most important panels at a glance. When viewing a run or a project, click the star icon at the top of a panel to star it. To filter the list to only starred panels, click the Starred tab at the top of the list.
- Search panels: When viewing a run or a project, use the panel search field at the bottom of the screen to filter which runs appear in each chart. You can search with JavaScript regular expressions to match patterns in run names.
- Chart tooltips: On line charts, tooltips show metric values with up to four decimal places so you can read small changes accurately.
- Stop runs: When viewing an in-progress run, click the action () menu, then click Stop run.
- View console logs: View console logs for active or completed runs, or download logs for completed runs. The app polls active runs for new log lines every 5 seconds. The most recent 10,000 lines display by default, and you can scroll backward to view older logs. Log search stays responsive even for large outputs.
- Switch teams: Use the team picker to change teams.
- Stay informed: Get updates on your experiments without opening your laptop using notifications. Remove alerts you no longer need from the Notifications tab by swiping them away.
Set up notifications
Configure notifications to receive updates about your experiments on your mobile device. The following sections describe the two kinds of notifications you can configure.Metric threshold alerts
Use metric threshold alerts to get notified when a metric crosses a value you specify.- Navigate to a run.
- Tap the graph to enter fullscreen view.
- Tap the bell icon in the top right.
- Set notifications that trigger when future runs cross the specified metric threshold.
Run failure alerts
Use run failure alerts to get notified when runs in a project fail.- Navigate to a project.
- Tap the action () menu in the top right.
- Select Run failed alert to receive notifications for future run failures in that project.