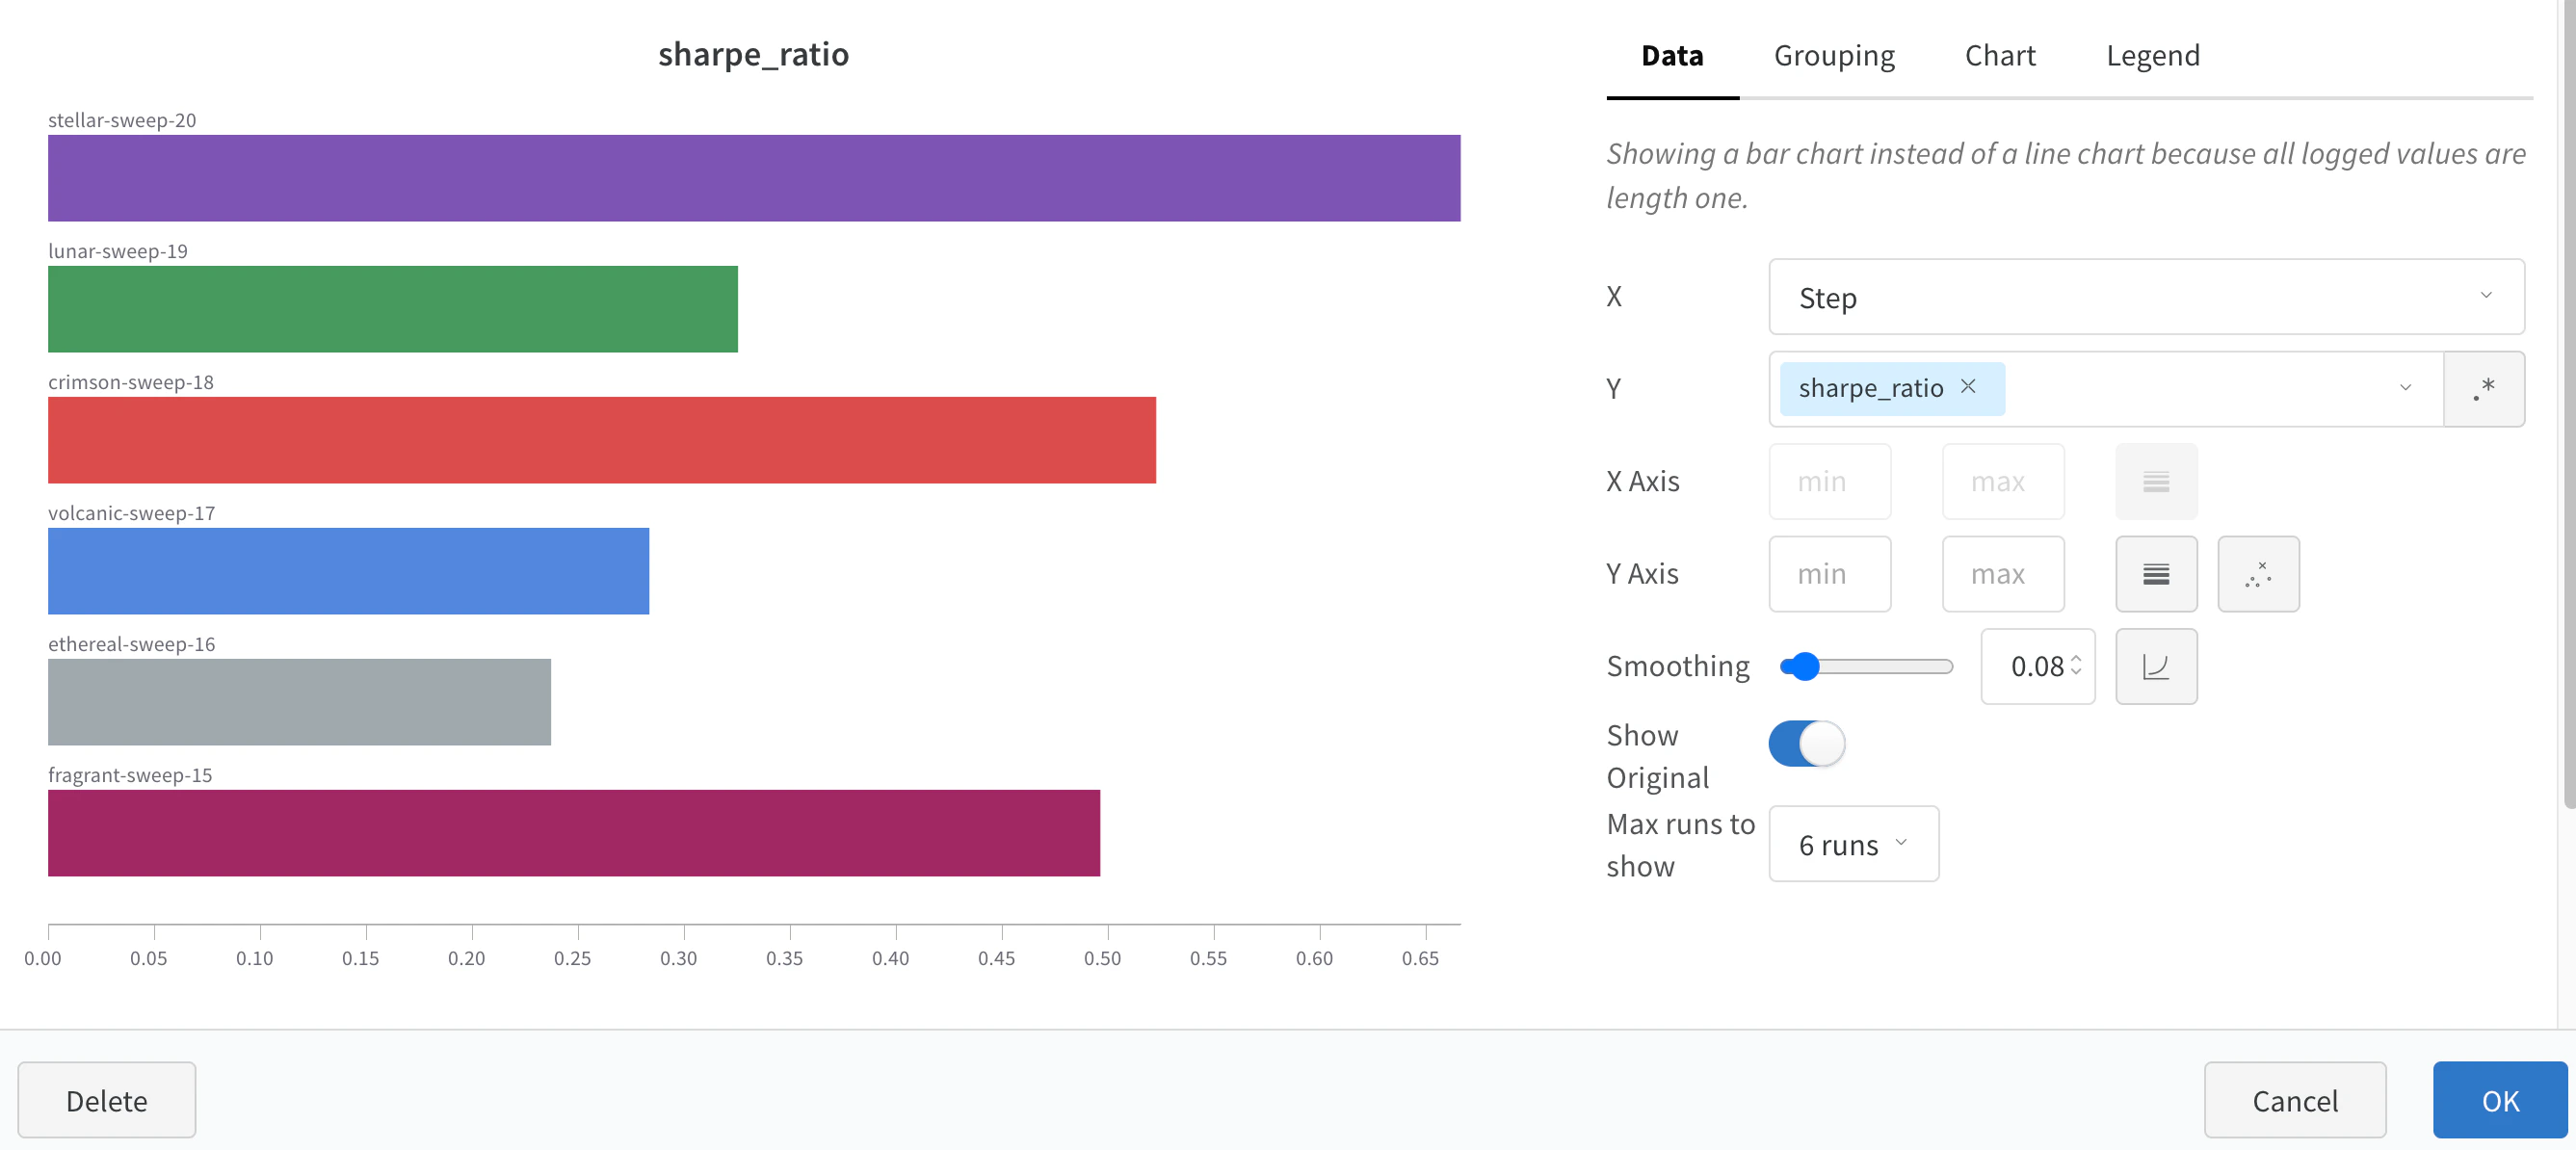
A bar plot presents categorical data with rectangular bars that you can plot vertically or horizontally. Use bar plots to visualize metrics, compare categorical data, and customize axes for your runs. Bar plots appear by default withDocumentation Index
Fetch the complete documentation index at: https://wb-21fd5541-docs-2661.mintlify.app/llms.txt
Use this file to discover all available pages before exploring further.
wandb.Run.log() when all logged values are of length one.
Customize bar plots
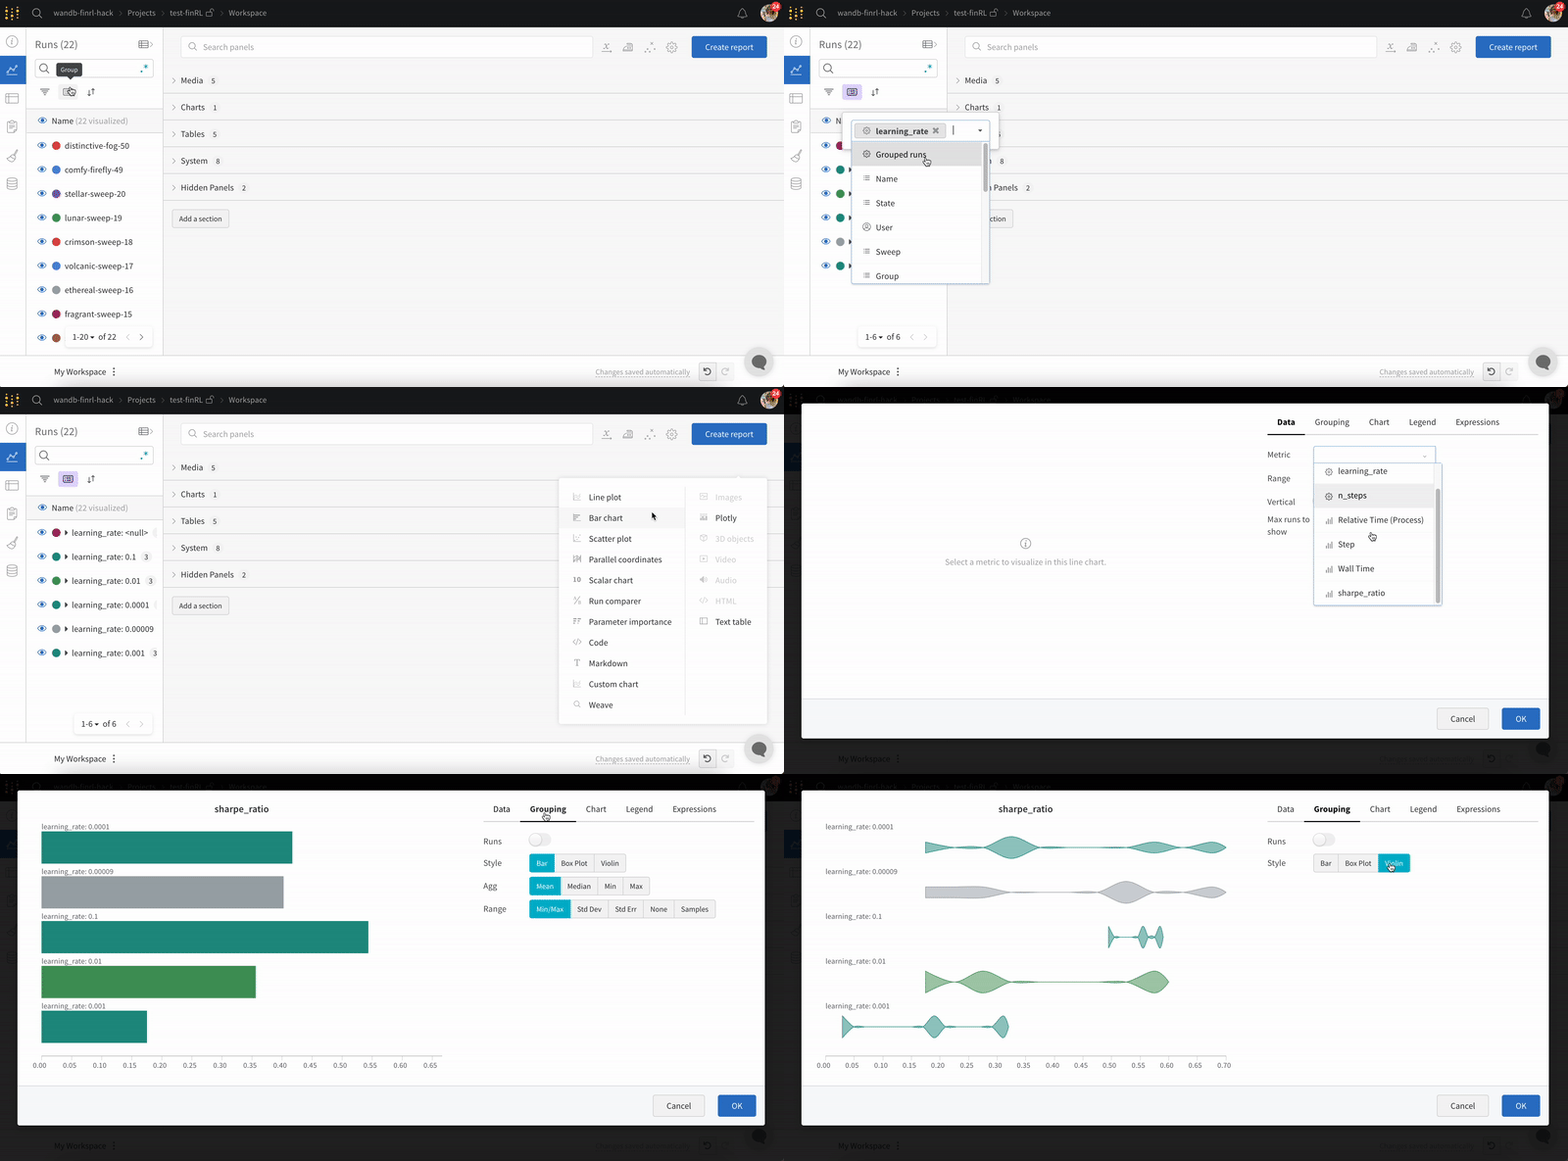
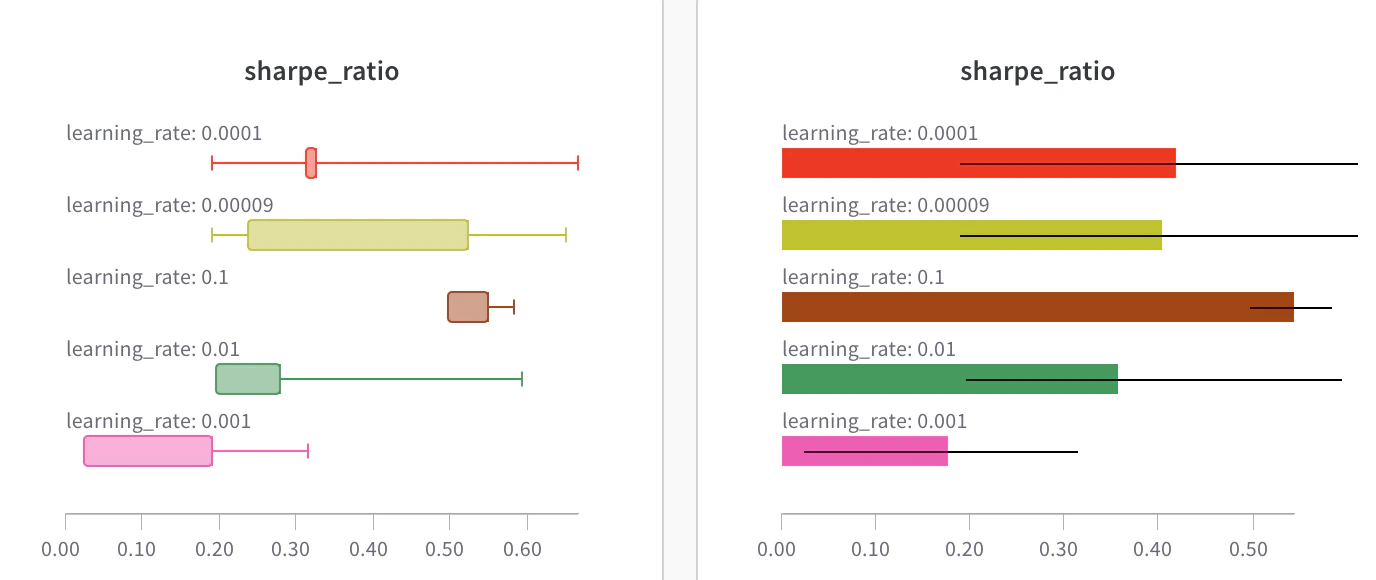
You can also create Box or Violin plots to combine many summary statistics into one chart type. To create a box or violin plot:- Group runs through the runs table.
- In the workspace, click Add panel.
- Add a standard Bar Chart and select the metric to plot.
- Under the Grouping tab, pick Box or Violin to plot either of these styles.